
Statistics all the Things
It’s often useful to know what is happening on a production Asterisk server. While gathering machine statistics – such as disk I/O, CPU and memory usage, and other characteristics – is a relatively well understood problem, that isn’t always sufficient. It’s often useful to correlate what is happening inside of Asterisk with statistics gathered from the underlying machine. For example, CPU usage on a system running only Asterisk often tracks closely with the number of channels; correlating the two can help you derive how many simultaneous calls your machine can handle.
One way of gathering these statistics is to use StatsD. If you haven’t heard of or used StatsD in the past, StatsD is a daemon that aggregates statistics from a variety of sources. In various recent versions of Asterisk, a variety of modules have been added that allow an Asterisk system to send useful statistics to a StatsD server. In this blog post, we’ll cover some of the ways Asterisk can send useful statistics to a StatsD server.
Configuring Asterisk to Send Statistics to StatsD
First, you’re going to want to set up StatsD, along with some way to view the statistics. StatsD itself is merely a statistics gathering engine; it doesn’t, by itself, display the data that it gathers. One of the more common viewing options is Graphite, which is what we’ll be using in this blog post.
Note: We won’t cover setting up StatsD with Graphite in this blog post. There’s a lot of great information out there on ye olde interwebs on how to go about doing this. In my case, I prefer to use Docker with a pre-built image of StatsD/Graphite, as it is a cinch to get set up and running. In this blog post, we’re just going to assume that you have StatsD set up and running on the same machine as Asterisk.
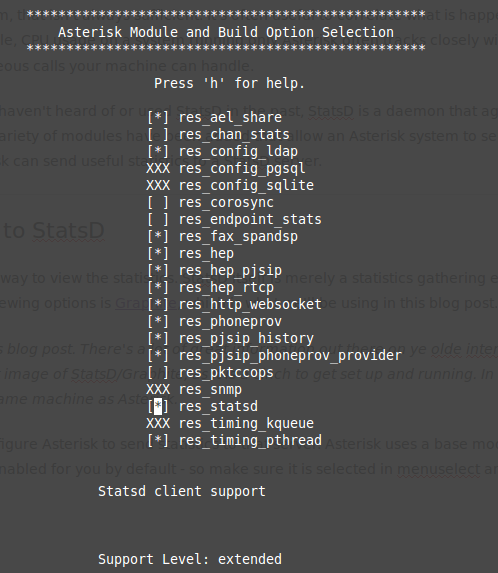
Once you have your StatsD server listening, we need to configure Asterisk to send statistics to that server. Asterisk uses a base module, res_statsd , to manage the transport of data to the StatsD server. This may not be enabled for you by default – so make sure it is selected in menuselect and built when you build Asterisk:
Once you’ve installed res_statsd , we’ll need to configure it via statsd.conf . There isn’t a lot to this configuration file; in fact, there’s only four options, of which, we really only need two of them! The options are:
- enabled : Whether or not you want to enable sending statistics. This will affect all statistics that are sent to StatsD; clearly, in our case, we want to set this to true .
- server : The IP address and port of the StatsD server to send statistics to. The port will default to 8125 , the default for StatsD.
- prefix : Optionally, a prefix to append to your statistics. This is useful when your StatsD server is hosting statistics from services other than Asterisk, as you can group all of the Asterisk statistics together under a single root key.
- add_newline : Another option, this one is useful when debugging. We can run netcat instead of StatsD to test if Asterisk is sending statistics; in our case, we’re just going to send the statistics directly to StatsD, which doesn’t care about newlines.
For our purposes, the following suffices for our statsd.conf :
[general]
enabled = true
server = 127.0.0.1
Assuming, of course, that our StatsD server is listening on local host on port 8125 , then that’s all we need to get started!
Channel Statistics
The first module that provides statistics to StatsD is res_chan_stats , first added in Asterisk 12.0.0. This module was originally written as a proof of concept for an internal publish/subscribe message bus in Asterisk called Stasis. As a result, it outputs a number of things; the one that we’re most interested in are, of course, the channels!
While there is nothing to configure, you will need to make sure that res_chan_stats is enabled in menuselect and installed:
asterisk $ menuselect/menuselect --enable res_chan_stats menuselect.makeopts
asterisk $ make && sudo make install
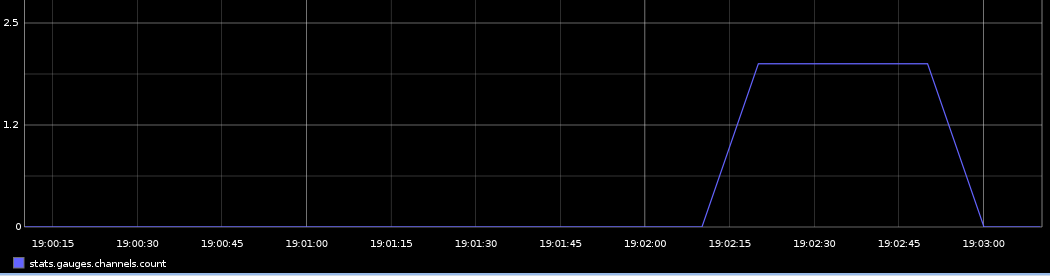
Probably the most interesting statistic res_chan_stats provides is simply a count of the active channels in Asterisk via the gauge channels.count . For example, I can make a call between two PJSIP endpoints – Alice and Bob – and will see something like the following:
Endpoint Statistics
Note: This functionality is new in Asterisk 13.7.0.
If you want to drill down further into what each individual endpoint in Asterisk is doing, you can use the res_endpoint_stats module. Once loaded, it will provide statistics on an endpoint by endpoint basis. Once again, we need to make sure it is enabled and installed:
asterisk $ menuselect/menuselect --enable res_endpoint_stats menuselect.makeopts
asterisk $ make && sudo make install
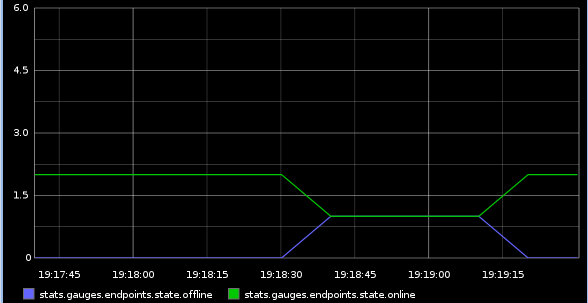
As in the previous example, making a call from Alice to Bob will now give me a number of interesting things about their endpoints. First, I can track how many endpoints are simply online and available via the gauges in endpoints.states. The graph below shows that I had two endpoints that were available; after some time one of them went offline; then after some more time it came back online.
I can also track the number of channels that each endpoint is servicing via individual gauges under the respective endpoint technology – in my case, PJSIP.alice and PJSIP.bob . For a single phone, these may not be that interesting, but they are rather useful for an endpoint that represents an upstream SIP provider.
PJSIP Statistics
Note: this functionality is new in Asterisk 13.7.0.
In addition to the specific statistics modules listed previously, Asterisk’s res_pjsip module provides StatsD statistics for PJSIP contacts. Generally, this is most useful when the aor for an endpoint is set to qualify the contacts using the qualify_frequency option. When the contacts are qualified, we will get the round trip time from Asterisk to each contact.
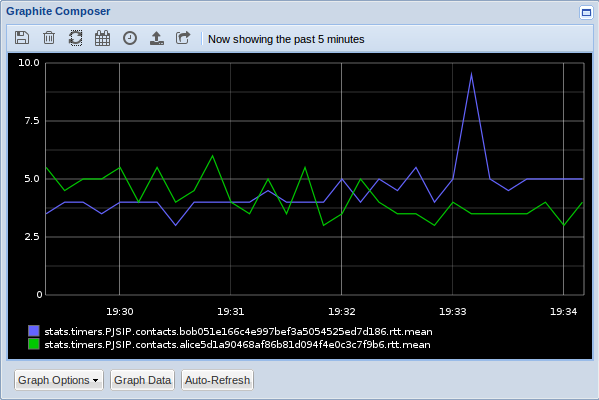
Because contacts will usually contain special characters that StatsD won’t like (such as ‘.’), the name of the contact is hashed and appended to the name of the aor that owns that contact. Thus, in my case, Alice and Bob are under timers.PJSIP.contacts.alice5d1a90468af86b81d094f4e0c3c7f9b6.rtt and timers.PJSIP.contacts.bob051e166c4e997bef3a5054525ed7d186.rtt , respectively.
Note: The output of ‘pjsip show contact’ includes the first few characters of the hash to help you match the contact to its statistics.
Because these are timers, we can graph all sorts of statistics about the round trip time. One useful metric is simply the mean, shown below for my two phones:
Much like what is provided by res_endpoint_stats , we can also get the state of each individual PJSIP contact or, if using res_pjsip_outbound_registration , each individual outbound registration, via the gauges PJSIP.contacts.states and PJSIP.registrations.states , respectively. These states can help show the overall status of the contacts and outbound registrations, in a somewhat similar fashion to the endpoint state statistics.
Dialplan Statistics
Note: This functionality is not yet released! It will be available in Asterisk 14.0.0, or, for the enterprising soul, in the master branch of Git.
Another way to emit statistics is simply to do it yourself. Using the StatsD dialplan application, you can send any statistic that StatsD supports. As an example, say we wanted to track the number of channels executing in a particular pattern match extension. You could set a gauge to be incremented for each channel executing in a particular extension:
exten => _XXXX,1,NoOp()
 ...
exten => n,StatsD(g,extensions.${EXTEN},+1,1)
 ...
The tricky part, of course, is that this won’t decrement the count for the extension! That can leave you with a never ending, always incrementing counter, which isn’t super useful.
We need a bit more intelligence here. First, we need to decrement the counter whenever the channel hangs up; we can do this pretty easily with a hangup handler. Second, since a channel can move between extensions, or run sub-routines, we need to remember the extension that we bumped the count on. The final dialplan snippets look something like the following:
[default]

exten => statsd_clear,1,NoOp()
 same => n,StatsD(g,extensions.${STATSD_EXTEN},-1,1)
 same => n,Return()

exten => _XXXX,1,NoOp()
 ...
exten => n,Set(STATSD_EXTEN=${EXTEN})
exten => n,Set(CHANNEL(hangup_handler_push)=default,statsd_clear,1)
exten => n,StatsD(g,extensions.${STATSD_EXTEN},+1,1)
 ...
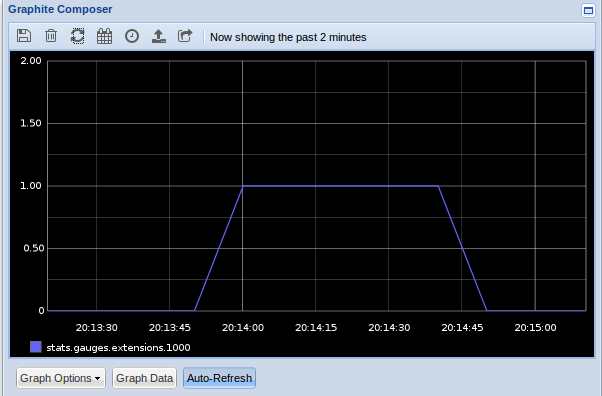
With that in place, when I dial my 1000 extension, I now get a specific gauge metric for it:
Note: For more information on the new StatsD dialplan application, check out the wiki page here: https://wiki.asterisk.org/wiki/display/AST/Utilizing+the+StatsD+Dialplan+Application
